gallery

Last modified date

Comments: 0

ilovecharts:

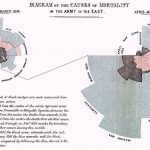
Florence: Mother of Nursing – Mother of  Infographics?

Florence Nightingale was not only a pioneer in the world of nursing – she was also a statistician. This polar area diagram of causes of death in the Crimean War is a form of pie chart that she created. It’s informative and combines graphic and text to tell a powerful story about the decline in deaths from infectious diseases during the war.

Bob Bruhin

Bob Bruhin is a web developer, tour guide, art photographer, author, blogger, and graphic designer. His love of urban landscapes, especially in post-industrial Philadelphia, PA, leads him to document some of the darker corners of his city.

Share

Leave a Reply

This site uses Akismet to reduce spam. Learn how your comment data is processed.